A quick overview of the trading book
When you pull up a trading platform, a ten deep market is shown on both the buy side and sell side. Did you know you can break down each data piece for more information?
How many orders make up the total contracts that you see? |
How quickly do those order counts change?
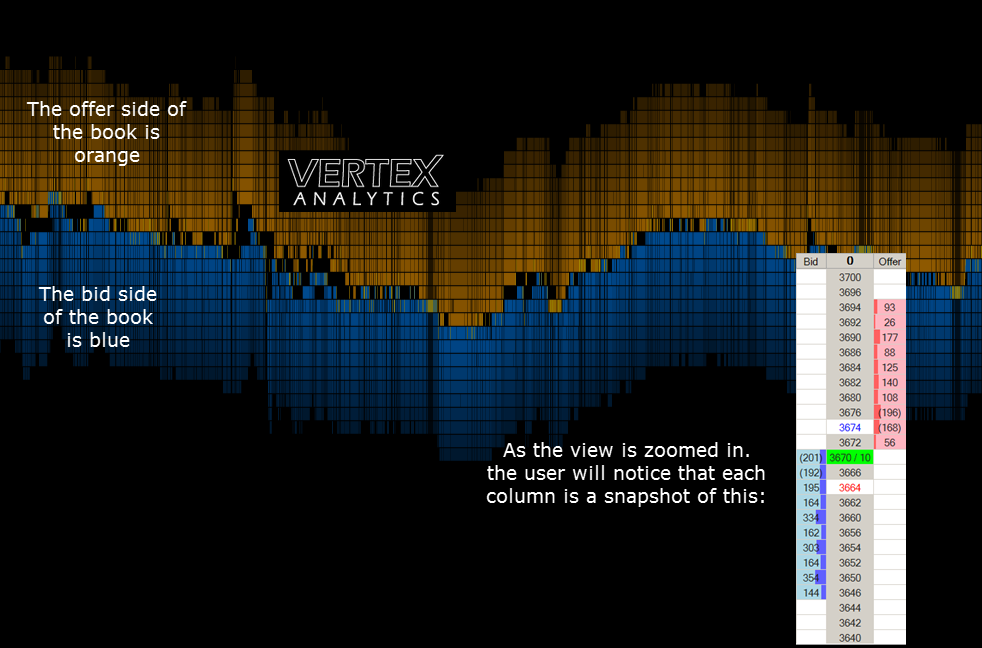
Most of you should recognize the zoomed in view from your trading platform. This is corn. Each little orange and blue line represents a change in, and thus, updated book. These lines are literally milliseconds apart. Last trade is at 3.67, a 10 lot. 201 are still bid for. The brackets on the number(201) tells you spreads are part of the total bid quantity. How many orders make up the bid? Are they stable orders, or an algorithm that can disappear in milliseconds? Commercial, spec, or computer? Just a small taste of the information that drives trading decisions today.
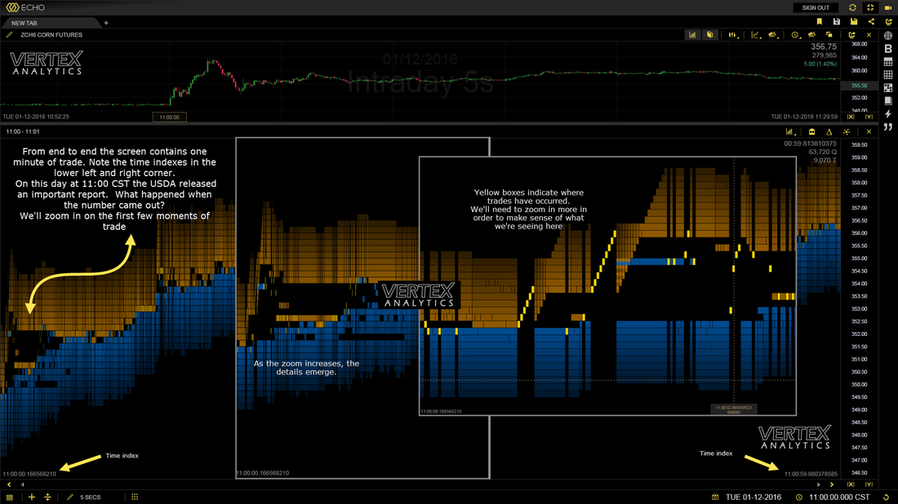
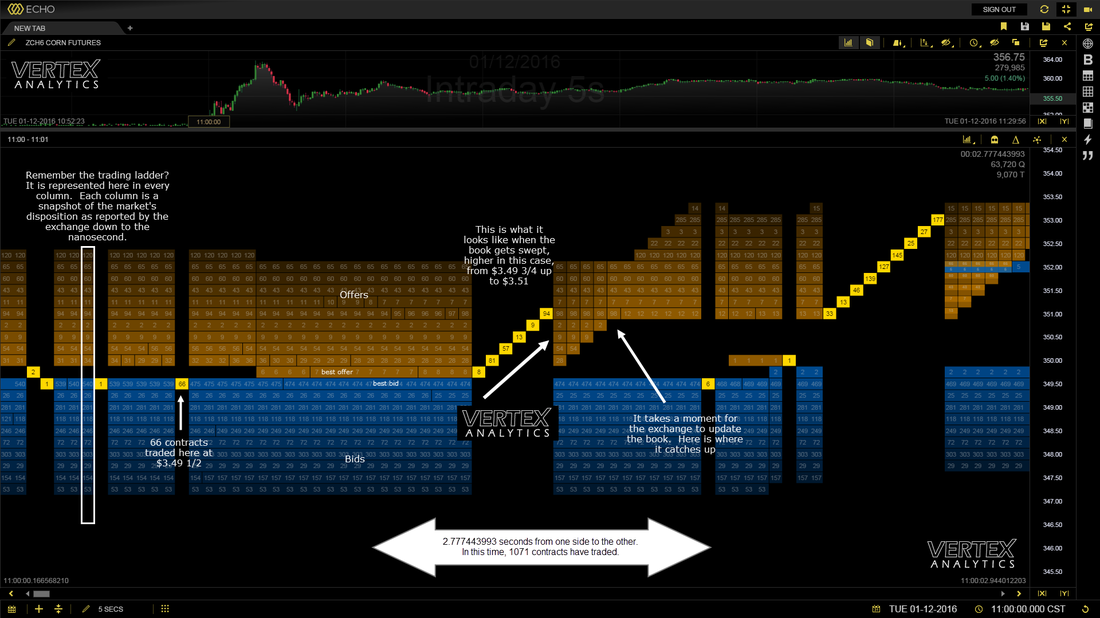
As the report comes out, you can see that the book looses its liquidity. Note the big gaping holes. Notice the yellow ladders. This is the book being swept with a buy order.. This entire page represents seconds of data. Thanks to Vertex Analytics.